paint-brush
Loss of Amazon Rainforest Resilience: Potential Driving Forces and Sources of Biasby@escholar

Loss of Amazon Rainforest Resilience: Potential Driving Forces and Sources of Bias

tldt arrow

Too Long; Didn't Read

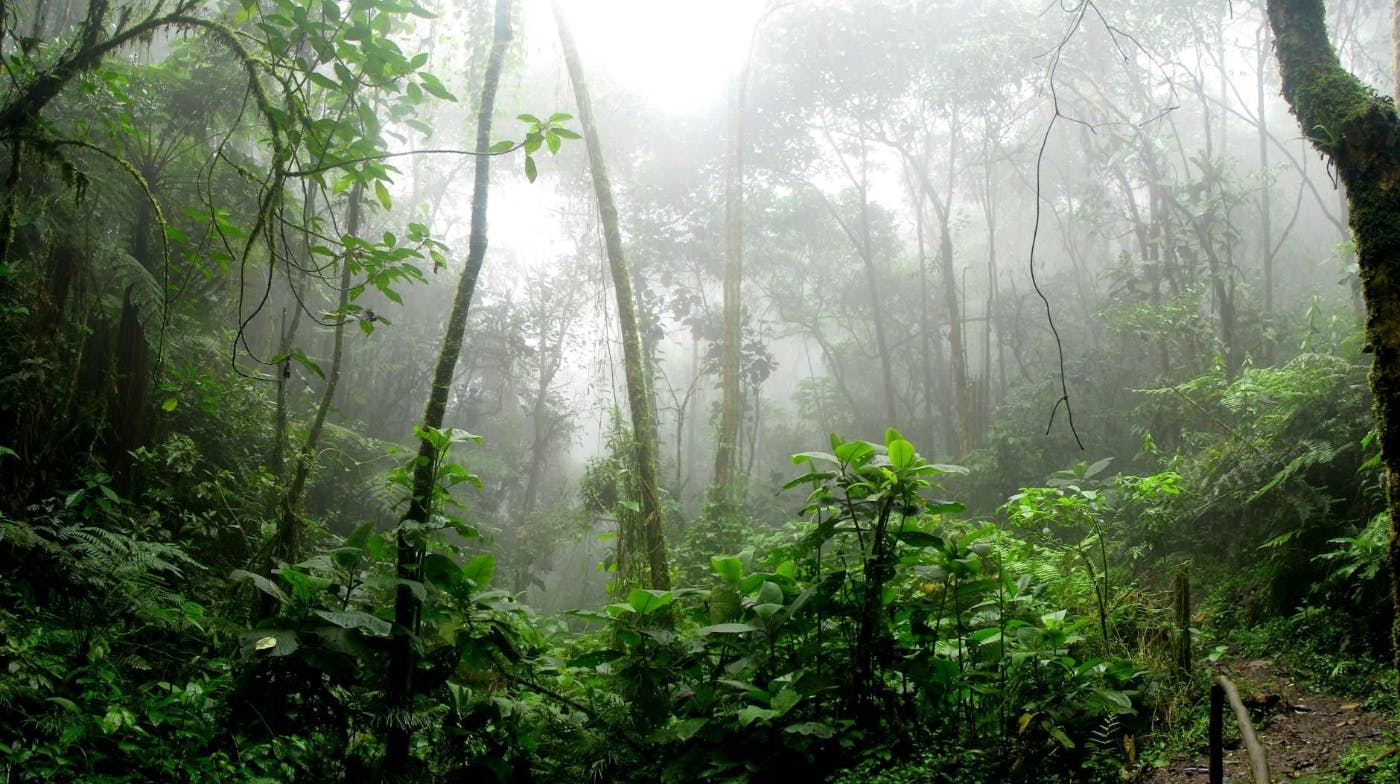
The Amazon rainforest (ARF) is threatened by deforestation and climate change, which could trigger a regime shift to a savanna-like state.
featured image - Loss of Amazon Rainforest Resilience: Potential Driving Forces and Sources of Bias
EScholar: Electronic Academic Papers for Scholars HackerNoon profile picture

This paper is available on arxiv under CC BY-SA 4.0 DEED license.

Authors:

(1) Lana L. Blaschke, Earth System Modelling, School of Engineering and Design, Technical University of Munich, Munich, Germany, Potsdam Institute for Climate Impact Research, Potsdam, Germany and [email protected];

(2) Da Nian, Potsdam Institute for Climate Impact Research, Potsdam, Germany;

(3) Sebastian Bathiany, Earth System Modelling, School of Engineering and Design, Technical University of Munich, Munich, Germany, and Potsdam Institute for Climate Impact Research, Potsdam, Germany;

(4) Maya Ben-Yami, Earth System Modelling, School of Engineering and Design, Technical University of Munich, Munich, Germany, and Potsdam Institute for Climate Impact Research, Potsdam, Germany;

(5) Taylor Smith, Institute of Geosciences, University of Potsdam, 14476 Potsdam, Germany;

(6) Chris A. Boulton, Global Systems Institute, University of Exeter, EX4 4QE Exeter, UK ;

(7) Niklas Boers, Earth System Modelling, School of Engineering and Design, Technical University of Munich, Munich, Germany, Potsdam Institute for Climate Impact Research, Potsdam, Germany, Global Systems Institute, University of Exeter, EX4 4QE Exeter, UK, and Department of Mathematics, University of Exeter, EX4 4QF Exeter, UK.

POTENTIAL DRIVING FORCES AND SOURCES OF BIAS

Text S12. The influence of the South American Monsoon system as a potentially bistable system

In the Amazon basin, the South American monsoon system and the atmospheric moisture recycling form a complex and potentially bi-stable system. Hence the monthly precipitation itself could exhibit signs of CSD, which would then drive vegetation changes that are wrongly interpreted as the destabilization of the vegetation. In Figure S16, the signs of the trend of variance, AC1 and spatial are compared between VOD and precipitation (Funk et al., 2014). We argue that due to the high amount of cells where the values differ in sign for the VIs and precipitation (sum of diagonal cells in boxes expected to be 50 % for random assignment), the observed changes in the indicators are likely a measure of critical slowing down in the vegetation and not only a direct effect of variability in precipitation.

Text S13. The influence of changes in precipitation as a potential driving force

If precipitation is the main driver of ARF resilience loss, one would expect that in regions with stronger decreases in precipitation (negative trend), more critical slowing down can be observed. This comparison in displayed in Figure S17. In parts, decreased precipitation could potentially explain the destabilization detected in the western Amazon basin by both bands of AMSR-E as well as in the western and northeastern regions detected by AMSR2’s bands. However it is important to note here that the number of cells with an increasing amount of precipitation and decreasing indicators and those with decreasing amount of precipitation and increasing indicators add up to only about 50 %, which is what is to be expected for a random assignment of positive and negative trends in both.

Text S14. The influence of changes in temperature

Instead of decreasing precipitation (see Figure S17, an increase in temperature can also lead to vegetation destabilization through water stress by higher evapo-transpirative demand. If this was the driver of the CSD, increasing temperatures must coincide with positive trends in the indicators of CSD in Figure S18. Yet changes in temperature cannot explain the detected destabilization in the years 2002 to 2011. For the time period of AMSR2, destabilization detected in the northeast (band C1) and the east (band C2) might at least partially be accounted for rising temperatures (the percentage of cells with rising/declining temperatures and in-/decreasing indicators falls between 48.6 % and up to 59.3 %).

Text S15. The potential bias induced by saturation

In case of optical sensors, their saturation over high biomass regions often renders the VIs insensitive to the subtle changes due to perturbations that a resilience analysis based on CSD relies on. The argument is that with decreasing biomass, the VIs become more sensitive, which then translates into a signal of CSD as a direct artifact of the higher perception of perturbations. Even though VOD results from observations of microwaves, we want to address the question of saturation in VOD. As Figure S19 shows, we cannot exclude this as an artifact for AMSRE’s band C as well as AMSR2’s two bands, as they hardly observed any cells with increasing biomass. Interestingly, AMSR-E’s band X detected an increase in biomass as well as a loss of resilience in most of the cells (77.3 % to 78.2 %). Thus, its signal of destabilization of almost the entire ARF during the years 2002 to 2011 is not an artifact of saturation of the band.


Figure S16: The South American monsoon system as a potentially bi-stable system. In this Figure, the signs of the trend of variance, AC1 and spatial are compared between VOD and precipitation (Funk et al., 2014). The sum of the diagonal cells in boxes is the amount of cells where the values differ in sign for the VIs and precipitation.


Figure S17: Precipitation as the main potential driver of resilience loss in the ARF. In this Figure, the signs of the trend of variance, AC1 and spatial are compared between VOD and the direct trends of precipitation. The sum of the diagonal cells in boxes is the amount of cells where the values agree in sign for the VIs and precipitation.


Figure S18: Increasing temperature as a potential driver. In this Figure, the signs of the trend of variance, AC1 and spatial are compared between VOD and the direct trends of temperature. The sum of the diagonal cells in boxes is the amount of cells where the values agree in sign for the VIs and precipitation.


Figure S19: Saturation as a source of artifacts. In this Figure, the signs of the trend of variance, AC1 and spatial are compared between VOD and the direct trends of the VIs. The sum of the diagonal cells in boxes is the amount of cells where the values agree in sign for the VIs’ CSD indicators and the VIs themselves.