423 reads
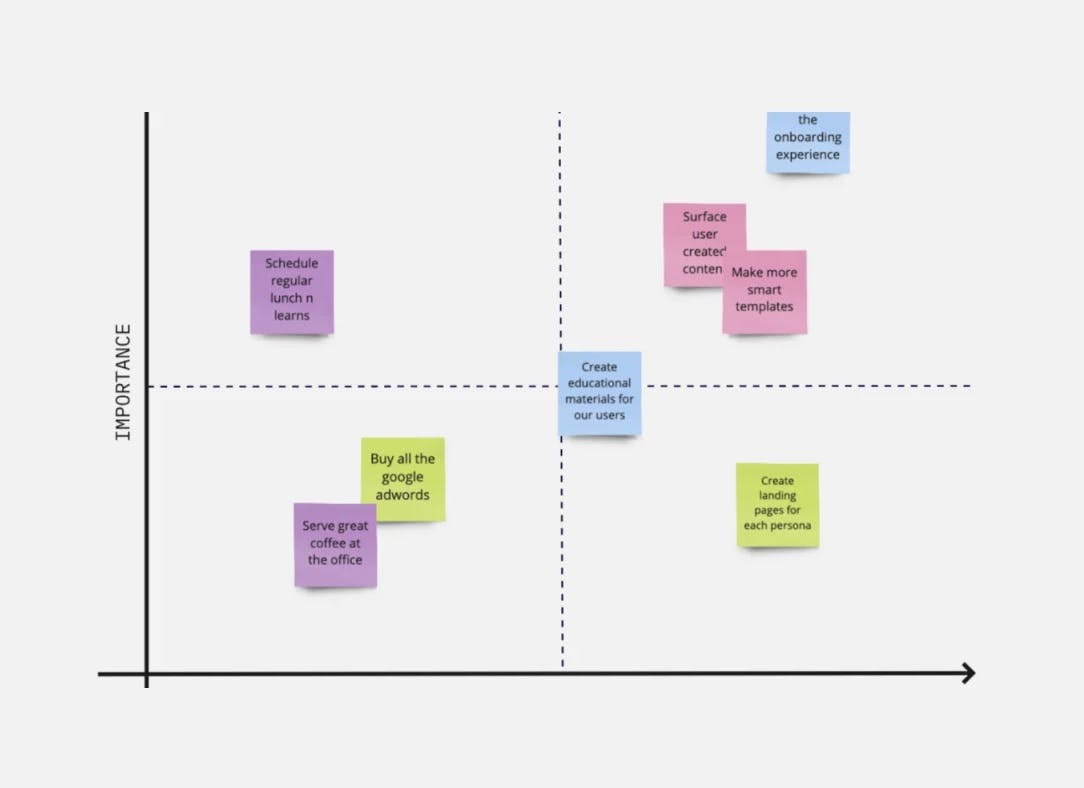
How to Define User Behavior Using Methods Like Grouping, 2x2 Matrix, and Venn Diagram.
by byPavel Tahil@paveltahil
I’m a Senior UX Designer / UX Researcher with more than nine years of experience.
November 21st, 2022


Audio Presented by
I’m a Senior UX Designer / UX Researcher with more than nine years of experience.


I’m a Senior UX Designer / UX Researcher with more than nine years of experience.
About Author

I’m a Senior UX Designer / UX Researcher with more than nine years of experience.
Comments