Real-Time Event Monitoring with Redpanda, OpenTelemetry, and Grafana
by Emmanuel Akin-AdemolaMay 5th, 2024


Too Long; Didn't Read
Discover the importance of events in event-driven architectures and follow a comprehensive tutorial on setting up real-time event monitoring using Redpanda, OpenTelemetry, and Grafana. Learn how to leverage Docker, Prometheus, and other tools to monitor system health and Kubernetes clusters effectively.


What are events and why use them?
An event is the detail that describes an action that occurred at a specific time; for example, the purchase of a product in an online store. The purchase event is defined by product, payment, and delivery as well as the time that the purchase occurred. The purchase action, or event, was done in the purchasing component of the system but has an impact on many other components, such as inventory, payment processing, and shipping.
In an event-driven architecture, all actions in the system are defined and packaged as events to precisely identify the individual actions and how they are processed throughout the system.
Instead of processing updates one after the other in a serial fashion and limiting the system's performance to its worst components, the event-driven architecture allows the components to process events at their own pace. This architecture helps developers to build systems that are fast and scalable.
Here are two use cases of event monitoring:
-
Monitoring system/server health
Processes are different and handling tasks differ according to the software, device, capability, and tasks. Now, if you are creating a complex application or software, you would want it to run efficiently and consistently on the server, relative to an operating system’s strength. Therefore, real-time event monitoring helps with the data needed to analyze background processes, manage malware, and optimize code performance.
-
Monitoring Kubernetes cluster
Kubernetes is a popular open-source container management platform, that accommodates manual configurations and automation. Real-time event monitoring is usually provided by Kubernetes to manage clusters resources which include CPU, memory, and storage — based on predefined or configured protocols, cluster operators will receive alerts if the required resources or nodes are underutilized or overutilized to hamper efficiency.
Perks of Integrating Redpanda with OpenTelemetry
With Redpanda, you are utilizing open-source data engineering and analytics tools. As such, your real-time analytics pipeline cost is reduced. Having access to the source code avoids vendor-locking, and affords you the flexibility to fit your organizational needs.
One of the main components of OpenTelemetry, or OTel for short, is the OpenTelemetry Collector. The OpenTelemetry Collector, or Otel Collector, is a vendor-agnostic proxy that can receive, process, and export telemetry data. It supports receiving telemetry data in multiple formats (e.g., OTLP, Jaeger, Prometheus, as well as many commercial/proprietary tools) and sending data to one or more backends, without locking you to a specific vendor to store and analyze this data.
Knowing how to integrate these technologies will help you reap their combined benefits of flexibility and scale.
Overview of Tools in this Tutorial: OpenTelemetry, Grafana, and Prometheus
This section briefly introduces the tools you will be using in this tutorial:
OpenTelemetry
OpenTelemetry is a collection of tools, APIs, and SDKs used to instrument, generate, collect, and export telemetry data (metrics, logs, and traces) to help you analyze your software’s performance and behavior. In this tutorial, we will be using the OpenTelemetry Collector to collect and export Prometheus metrics exposed by RedPanda.
Grafana
Grafana is an open-source tool used for interactive data visualization and data analytics. With Grafana, you can explore your metrics, logs, and traces with graphs, charts, annotations, and alerts. We will use Grafana in this tutorial to visualize our application metrics.
Prometheus
Prometheus is an open-source tool that operates a multi-dimensional data model with storage in form of metrics, operational simplicity, scalable data collection in form of time series, and a powerful query language(PromQL). In this tutorial, Prometheus provides the format in which our metrics would be represented.
Implementing Redpanda with OpenTelemetry and Grafana for real-time event monitoring
This section will show you how to integrate Redpanda, OpenTelemetry, and Grafana to achieve real-time event monitoring for your event-driven systems.


Implementing Redpanda with OpenTelemetry and Grafana for real-time event monitoring
Step 1: Prerequisites:
- Docker: We will be using Docker for this tutorial. Docker makes it easy to easily set up the tools required. You can install docker using instructions from this page: https://docs.docker.com/desktop/. We will use a single docker-compose file to run the needed Grafana, Prometheus, and Redpanda instances.
- Grafana: https://grafana.com/docs/grafana/latest/setup-grafana/installation/
- Prometheus: https://prometheus.io/docs/prometheus/latest/installation/
- RedPanda: https://docs.redpanda.com/docs/quickstart/quick-start-docker/
- OpenTelemetry: https://opentelemetry.io/docs/
Step 2: Building the docker image with docker-compose
In this step, we will use Docker to spin up the individual services needed for this demonstration.
-
Create a folder called
demo. This is the folder where we will be doing all of our work.-
Create one directory under the demo folder named
prometheus-data. -
Create a
prometheus.ymlfile under this new folder and copy the following content into it (note the name of the file - make sure the location is correct. This will be important for collecting exported Prometheus metrics from OpenTelemetry into Prometheus):global: scrape_interval: 15s evaluation_interval: 15s scrape_configs: - job_name: otel-collector static_configs: - targets: - otel-collector:8889 metrics_path: /metrics -
Create a
otel-collector-config.ymlfile under thedemofolder. Again, note the naming of the file. This file serves as the configuration file for the OpenTelemetry collector, necessary for collecting RedPanda Prometheus metrics into OpenTelemetry:receivers: prometheus: config: scrape_configs: - job_name: 'otel-collector' scrape_interval: 10s static_configs: - targets: ['0.0.0.0:8888'] - job_name: 'redpanda' scrape_interval: 10s static_configs: - targets: ['redpanda:9644'] processors: batch: exporters: logging: logLevel: debug prometheus: endpoint: "0.0.0.0:8889" service: pipelines: metrics: receivers: [prometheus] processors: [batch] exporters: [prometheus]
-
-
In the
demodirectory, create the followingdocker-compose.ymlfile needed to get the required RedPanda, Prometheus, Grafana, and OpenTelemetry services up and running:services: redpanda: image: docker.redpanda.com/vectorized/redpanda:v21.11.15 container_name: redpanda networks: - monitor-net command: - redpanda - start - --smp - '1' - --reserve-memory - 0M - --overprovisioned - --node-id - '0' - --kafka-addr - PLAINTEXT://0.0.0.0:29092,OUTSIDE://0.0.0.0:9092 - --advertise-kafka-addr - PLAINTEXT://redpanda:29092,OUTSIDE://localhost:9092 - --pandaproxy-addr - PLAINTEXT://0.0.0.0:28082,OUTSIDE://0.0.0.0:8082 - --advertise-pandaproxy-addr - PLAINTEXT://redpanda:28082,OUTSIDE://localhost:8082 expose: - 9644 ports: - 8081:8081 - 8082:8082 - 9092:9092 - 28082:28082 - 29092:29092 - 9644:9644 grafana: image: grafana/grafana-enterprise container_name: grafana networks: - monitor-net ports: - 3000:3000 prometheus: image: prom/prometheus container_name: prometheus ports: - 9090:9090 expose: - 9090 networks: - monitor-net volumes: - type: bind source: ./prometheus-data target: /etc/prometheus command: - '--config.file=/etc/prometheus/prometheus.yml' - '--storage.tsdb.path=/etc/prometheus/data' - '--web.console.libraries=/etc/prometheus/console_libraries' - '--web.console.templates=/etc/prometheus/consoles' - '--storage.tsdb.retention.time=200h' - '--web.enable-lifecycle' labels: org.label-schema.group: "monitoring" otel-collector: image: otel/opentelemetry-collector command: ["--config=/etc/otel-collector-config.yml"] volumes: - ./otel-collector-config.yml:/etc/otel-collector-config.yml container_name: otel-collector networks: - monitor-net expose: # - 8888 - 8889 ports: - "1888:1888" # pprof extension - "8888:8888" # Prometheus metrics exposed by the collector - "8889:8889" # Prometheus exporter metrics - "13133:13133" # health_check extension - "4317:4317" # OTLP gRPC receiver - "4318:4318" # OTLP http receiver - "55679:55679" # zpages extension networks: monitor-net: driver: bridge
-
Now run the
docker-compose up -dto get the services running. See screenshot below:


Step 3: Create a Redpanda Topic
Before we continue, first, a note on Event Processing and Topics:
Some components of distributed systems produce events as a result of a specific action that is done in that component. These components are referred to as “producers." When producers send these events and the events are read or stored in sequence, these events represent a replayable log of changes in the system, also called a "stream."
A single event includes information that is required by one or many other components in the system, also known as “consumers”, to effect additional changes. Consumers can store, process, or react to these events. Many times, consumers also run processes that produce events for other components in the system, so being a producer is not mutually exclusive from being a consumer.
Topics, as a concept in Redpanda, are essentially channels onto which events are broadcast. So let us create a topic called “chat-room.” We will produce some events (in the form of a simple message), to this “Topic” later and also consume the events.
docker exec -it redpanda rpk topic create chat-room --brokers=localhost:9092
This will create a topic named chat-room with one partition and one replica. You can also see all created topics with:
docker exec -it redpanda rpk topic list
Step 4: Setup Example NodeJS Application
This example application will produce and consume message events on the chat-room topic. Once events are broadcasted/consumed on RedPanda topics, RedPanda will produce relevant metrics about these events; we will come to this part later.
So, perform the following steps:
-
Create a working directory: Open up VSCode in the
demodirectory and run the following commands in your terminal:#create and enter the project folder mkdir redpanda-node cd redpanda-node #generate package.json npm init #install needed dependencies npm i -g typescript npm i -D @types/node npm i kafkajs npm i uuid npm i -D @types/uuid #generate tsconfig.json tsc --initThe above set of commands basically set up a skeletal NodeJS application for this demonstration.
-
Setup a producer: Create a
src/producer.tsfile and paste in the following content:// red-panda-node/src/producer.ts import {Kafka} from 'kafkajs'; const kafka = new Kafka({ clientId: 'chat-app', brokers: ['127.0.0.1:9092'] }); const producer = kafka.producer(); export function getConnection(user: string){ return producer.connect().then(() => { return (message: string) => { return producer.send({ topic: 'chat-room', // the topic created before messages: [//we send the message and the user who sent it {value: JSON.stringify({message, user})}, ], }) } }) } export function disconnect(){ return producer.disconnect() }That’s it, a working producer that sends strings entered by the user. Keep in mind that you can send buffers, meaning you can send pretty much anything you want.
-
Setup a consumer: Create a
src/consumer.tsfile and paste in the following content:// red-panda-node/src/consumer.ts import { v4 as uuidv4 } from 'uuid'; import {Kafka} from 'kafkajs'; const kafka = new Kafka({ clientId: 'chat-app', brokers: ['127.0.0.1:9092'] }); const consumer = kafka.consumer({ groupId: uuidv4() }); // we need a unique groupId I'll explain down export function connect() { return consumer.connect().then(() => consumer.subscribe({topic: 'chat-room'}).then(() => consumer.run({ eachMessage: async ({topic, partition, message}) => { const formattedValue = JSON.parse((message.value as Buffer).toString()); // everything comes as a buffer console.log(`${formattedValue.user}: ${formattedValue.message}`)// print the message }, }) ) ); } export function disconnect() { consumer.disconnect(); }There you have it. This will consume all produced messages and print them.
-
Create the entry point file of the application
src/index.ts. Copy the following content to the file:// red-panda-node/src/index.ts import readline from 'readline'; import * as Producer from './producer'; import * as Consumer from './consumer'; const rl = readline.createInterface({ input: process.stdin, output: process.stdout }); function start() { console.log('connecting...') Consumer.connect().then(() => { rl.question('enter user name \n', function (username) { // the username to print it along with the messages Producer.getConnection(username).then((sendMessage) => { console.log('connected, press Ctrl+C to exit') rl.on('line', (input) => { readline.moveCursor(process.stdout, 0,-1); // removing the input so you don't get duplicated items in terminal sendMessage(input); }) }) }); }) } start(); // handling shut down process.on('SIGINT', process.exit); process.on('exit', () => { Producer.disconnect(); Consumer.disconnect(); rl.close(); });
-
Run the following command (in the
redpanda-nodefolder) to run the application:tsc && node src/index.js
Run this as many times as you want clients. At least 2 so you can send and receive events between 2 terminals. See screenshots below:


Produce a message event to chat-room topic: “Hello my name is Emmanuel”
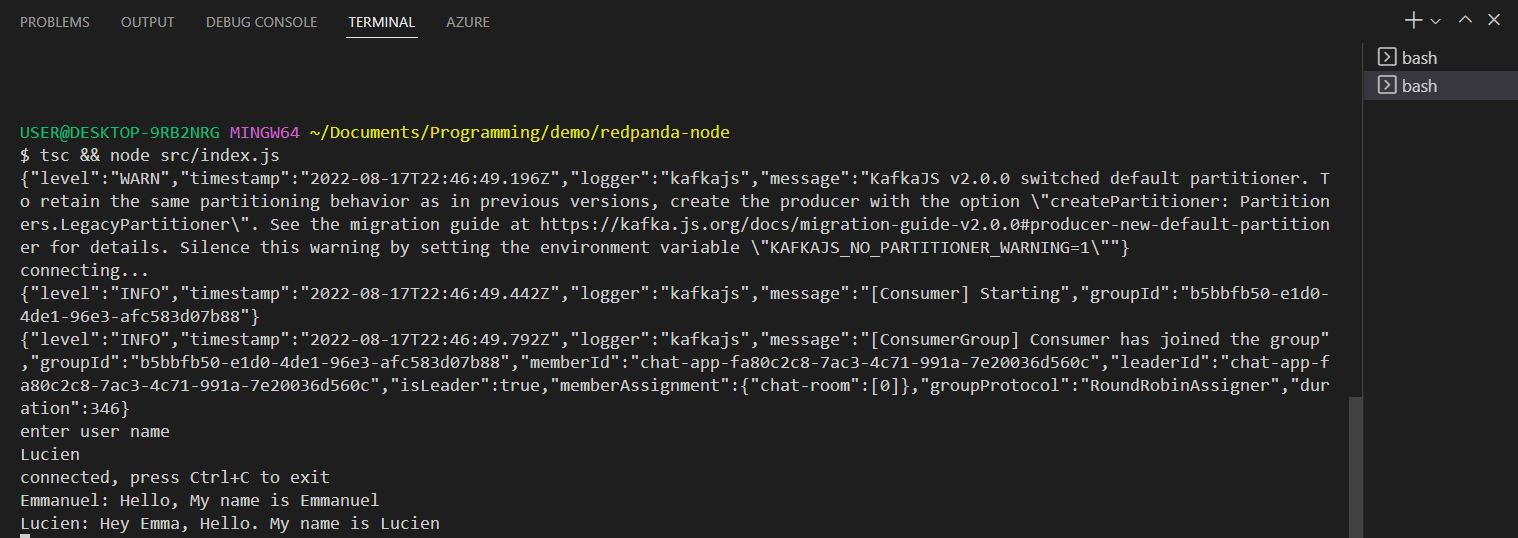
Produce a message event to chat-room topic: “Hey Emma, Hello. My name is Lucien”
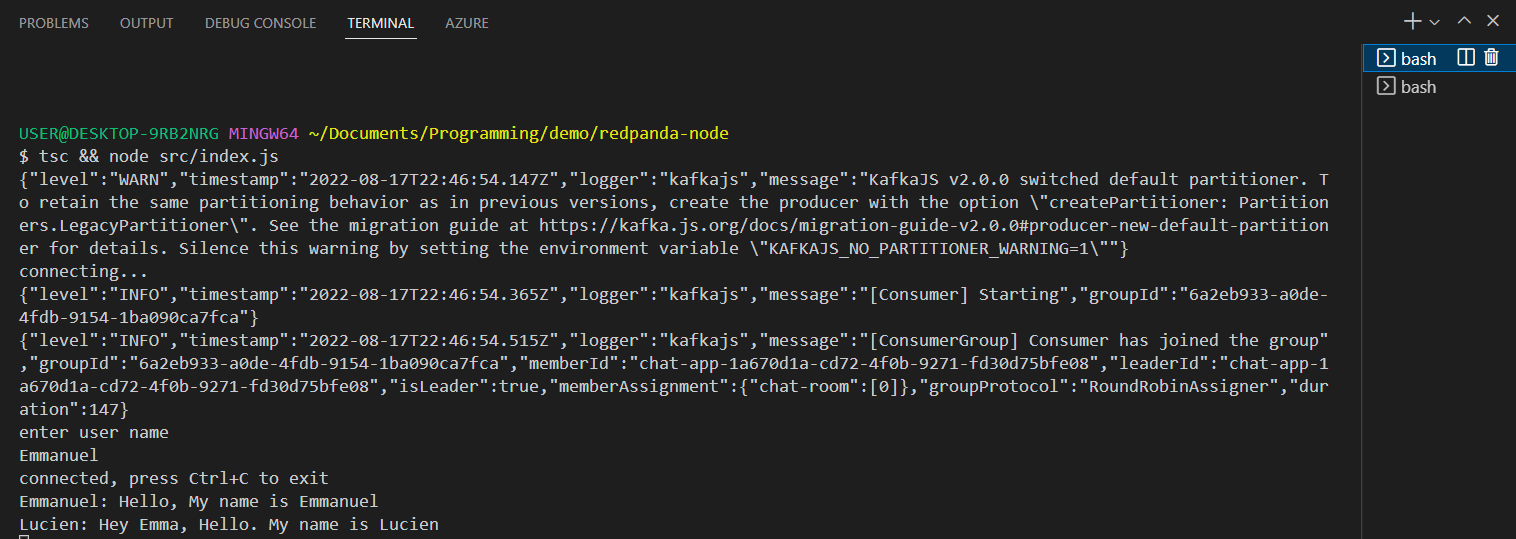
Observe that the broadcasted events are consumed by both client consumers.
Step 5: Visualize metrics using Grafana
-
Configure Prometheus Data Source in Grafana: Redpanda exposes Prometheus metrics to aid monitoring, but since we need to visualize the metrics in Grafana, we must first configure a Prometheus Data Source from which we would retrieve the metrics.
-
Open your grafana UI at http://localhost:3000.
-
Enter “admin” for username and password.
-
Click on the "cogwheel" in the sidebar to open the Configuration menu.
-
Click on "Data Sources."
-
Click on "Add data source."
-
Select "Prometheus" as the type.
-
Name the datasource “prometheus.”
-
Set the Prometheus server URL as
http://prometheus:9090. -
Click "Save & Test" to save the new data source.
-
-
Generate Grafana Dashboard: Generate a comprehensive Grafana dashboard to visualize monitoring metrics such as node health, errors, and latency. In the demo folder, run this command
docker exec -it redpanda rpk generate grafana-dashboard \
--datasource prometheus \
--metrics-endpoint otel-collector:8889/metrics > redpanda-dashboard.json
Your file structure should look this way by this point:


-
Import Dashboard: Import the generated dashboard file into Grafana for visualization.
-
Under the dashboard icon in your Grafana UI, click “Import.”
-
Import the generated
redpanda-dashboard.jsonfile from your laptop. -
Click “Import”
-
Send messages between the two terminals opened before and relevant metrics will reflect in the graphs.
-
Here’s a screenshot of the imported dashboard:


You can toggle open the other closed panels to view more graphs. These graphs provide insights into the metrics that your application is generating.
Conclusion
Now that the concepts of Grafana, Opentelemetry, and Prometheus have been clearer to you and how you can monitor software applications’ performance with the simple illustration this tutorial has provided. With the right integration demonstrated throughout this tutorial, here’s a good and flexible solution to meet your software development and real-time monitoring needs.
If you found this tutorial interesting, checkout configuring OpenTelemetry for tracing: https://opentelemetry.io/docs/concepts/signals/traces/
To learn more about Redpanda and stay up-to-date, see Redpanda's source codes available on GitHub and join the Redpanda Community on Slack with fellow developers and data engineers.

L O A D I N G
. . . comments & more!
. . . comments & more!
About Author

TOPICS
THIS ARTICLE WAS FEATURED IN...


RELATED STORIES


Apache Kafka: How Does It Work? #kafka
Feb 13, 2021